Measuring the impact of high wireless channel utilisation
I don’t know if anyone else has thought of this approach, but I discovered a nice way to assess the impact of a busy RF environment on a wireless stations ability to transmit a frame.
A brief bit of background information- an 802.11 station can only transmit a frame when the channel is not being used. Unfortunately there can be many reasons why a channel might be busy, for example another station transmitting, or a source of interference like a rogue AP, or a source of noise like a security motion detector. There are many tools for viewing how busy a channel is, such as examining radio channel utilization reported by APs, spectrum analysis using Cisco CleanAir or Metageek Channelyzer Pro, these provide good visualisations of utilisation.
Here’s the problem though- they don’t tell you the impact to a client station- how is the interference affecting a station trying to get air time to transmit its frame. Does it have to wait 100ms to send a frame, or 800ms, if the station is sending packets from a real-time application like Microsoft Lync, or Cisco IPT for example, waiting 800ms to get air time is not acceptable.
Here’s an example of a radio that is busy, as you can see the source of the high utilisation is interference, in this case due to a large number of rogue APs sending beacons at 1Mbit/sec using inefficient CCK modulation.
So, how are wireless stations being impacted by this? Using a wireless packet sniffer we can capture the beacons for the SSID that we want to analyse. Beacons are sent every 100ms by default, for each SSID. By looking at the delta time between the transmission of the beacons we can understand how long the AP needs to wait before getting air time.
Here’s a Wireshark display filter to capture beacons for a specific BSSID-
‘wlan.fc.type_subtype == 0x0008 && wlan.bssid == xx:xx:xx:xx:xx:xx’
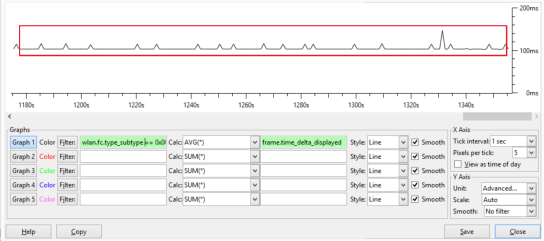
Using the WireShark I/O graph we can see in the example below that the average delta between beacons is 100ms, the AP is able to get air time very easily.
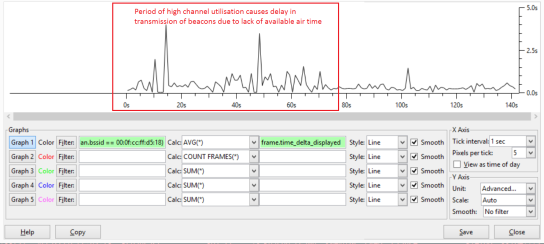
Here’s another example where the RF is busy, there are very significant delays in sending beacons. At times there is a three second delay between transmission of beacons, it’s not hard to imagine the impact of this type of delay on an interactive application like voice, video or desktop sharing.
There are some caveats to this approach, for example beacons may be given lower priority to other packets, such as those marked with high priority 802.11e values. There may also be other factors that cause delay in transmission of beacons, such as utilisation of resources (CPU etc.) on the AP. It’s not a fool proof approach, but I find it is a fairly accurate way to understand the impact of high channel utilisation on a clients ability to transmit.
Another approach could be to use an IP SLA to measure deviation in latency to a client, but this may also measure other components of the network in the path to the destination.
Let me know your thoughts in the comments section.
Read Full Post | Make a Comment ( None so far )Wireshark Capture Vs Display Filters
Bit of background info:
Libpcap – API/C/C++ libarary used for packet capture at the link layer on *nix machines
Winpcap – Libpcap API ported to Windows machines for compatibility
Berkeley Packet Filter – format/syntax used for capture filtering withing TCPDump and Wireshark etc
TCP dump – network analyser created by Lawrence Berkeley National Laboratory
Wireshark – network analyser created by Gerald Combs (now Riverbed)
Wireshark uses the Berkeley Packet Filter format for capture filtering, as this is the format used by Libpcap and Winpcap libraries for capturing of packets at the NIC. It’s generally not possible to use BPF for display filters, however certain filters do overlap.
BPF filter ‘tcp port 25 and host 192.168.1.1’ is a valid capture filter, but will not function as a display filter.
Display filter ‘tcp.port==25 && ip.addr==192.168.1.140’ is the equivalent display filter.
Capture filter examples:
not host 192.168.1.2
tcp port 80
ether host d4:87:d8:14:2f:18
Custom profile capture filters are stored in C:\Users\%username%\AppData\Roaming\Wireshark\profiles\profilename\cfilters
Display filter examples
!ip.addr == 192.168.1.2 – find all packets where ip.addr is not 192.168.1.2
http.request.uri contains google.com – finds all packets where the URI (uniform resource identifier) contains google.com
eth.src[4:2] == f8:ee – find f8:ee in field eth.src, start looking from the 4th byte, for the next two bytes
It’s possible to capture packets using tshark (command line) by issuing tshark.exe -R “display filter here”.
Any field within the packet detail can be applied as a filter, for example you can right click on content type field within a HTTP packet and click copy > as filter, as you can apply or prepare as filter. http.content_type == “image/jpeg”.
A quick way to filter on a specific TCP flow/conversation is to use the TCP stream number, a unique ID assigned by wireshark to each TCP conversation. The stream ID can be found by examing the TCP header in packet details, field name “tcp.stream”.
Read Full Post | Make a Comment ( None so far )


